Instructions:
The map above provides a way for you to navigate to the air quality trends results for a National Forest or Wilderness in the eastern United States. You can also view the air quality trends for numerous ambient ozone monitoring sites within the United States and Puerto Rico, or download one or more years of data to use with the Ozone Calculator or your software.
Overlay Displays:
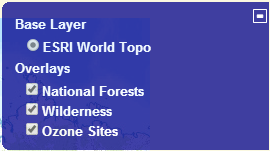
Choose which layers you would like to have displayed on the map by selecting the plus symbol ( ) on the right side of the map. Next, you will see a list of Overlays and you can decide which Overlays will be displayed by having a check mark in the box next to the name. The following shows that all three Overlays will be displayed on the map:
Navigation Tools:
Click on a National Forest or Wilderness polygon, or ambient ozone monitoring point. Next, a small box will appear that shows the name of the location or monitoring site and the available data summaries. If you wish to zoom in, use your mouse wheel or double click on the map. The following table shows the available choice for each overlay and when you select one of the choices then a new tab will open and display the information for the location you selected.
| National Forest (polygons) | Wilderness (polygons) | Ambient Ozone Monitors (points) |
| Acid Deposition | Acid Deposition | Hourly Ozone Data |
| Spatial Ozone*/ | Spatial Ozone* Visibility (Class I areas only) | Ozone Summaries |
*/ The spatial ozone results are a spatial statistical summary using the Spatial Ozone Data.