Images from the Geostationary Satellite (GOES) for March 18, 2006 were obtained from the National Climatic Data Center, National Oceanic and Atmospheric Administration (NOAA) and compiled below into a movie. Images were obtained at approximately 15 minute intervals of an area where smoke was emitted from a prescribed fire from eastern Tennessee. The atmosphere had marginal dispersal characteristics and elevated fine particulate matter concentrations caused some respiratory problems for sensitive people and a nuisance to other people in western North Carolina. The images final processing was accomplished using a geographic information system (GIS) to show the development of the smoke plume over time in relation to the communities and shaded relief (elevation) map. Darker plumes had a greater reflectance value then areas with a light gray. The darker plumes are a result of a higher concentration of water and pollutants in the smoke. Early in the simulation there is a dark plume that is shown in the upper corner of the graphic below. As the smoke disperses downwind then the reflectence value is lower, hence the lighter gray colors. It should be noted that the reflectance values are a result of what the satellite detected from the top of the plume toward the ground and the images can not be used to infer ground level concentrations of fine particulates. However, the images do show downwind transport of the smoke over time. The movement of the smoke was influenced by how high it rose into the atmosphere in combination with the surroundings terrain, which restricted the smoke to follow the French Broad River Valley.
.")
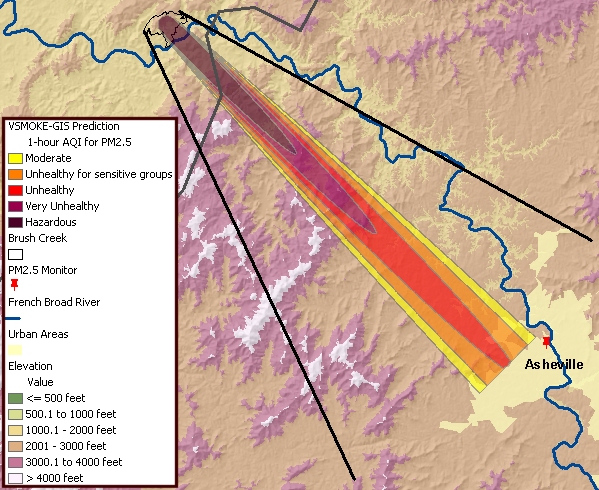
 The VSMOKE and VSMOKE-GIS model were utilized after the smoke event to predict what concentration of fine particulate matter may have occurred with 30 kilometers of the prescribed fire. The hour modeled, 1:00 to 2:00 PM, had the maximum release rate of fine particulate matter. This hour produces the “worst case” predictions of what the fine particulate concentrations may have been down wind of the burn unit. The winds transporting the pollutants were steady and from the northwest. The VSMOKE-GIS results need to be interpreted cautiously in mountainous terrain. Lines are drawn at 30 (or 45 ) degrees from the plume centerline on either side of the burn unit (see below). This represents the area that could be impacted by smoke. The model is not capable of predicting the plume will follow the river valley. However, it would be consider a high likelihood when interpreting the modeling results that the smoke would follow the French Broad River Valley. VSMOKE estimated the maximum 1-hour fine particulate matter concentration at a distance approximately the same as the Buncombe County monitors (31 miles) as 173.49 micrograms per cubic meter. This estimate is higher then the maximum monitored value of 131 micrograms per cubic meter recorded between 5:00 and 6:00 PM. Typically, models such as VSMOKE and VSMOKE-GIS are expected to over-predict the downwind concentration of pollutants.